Student Assessment Best Practices
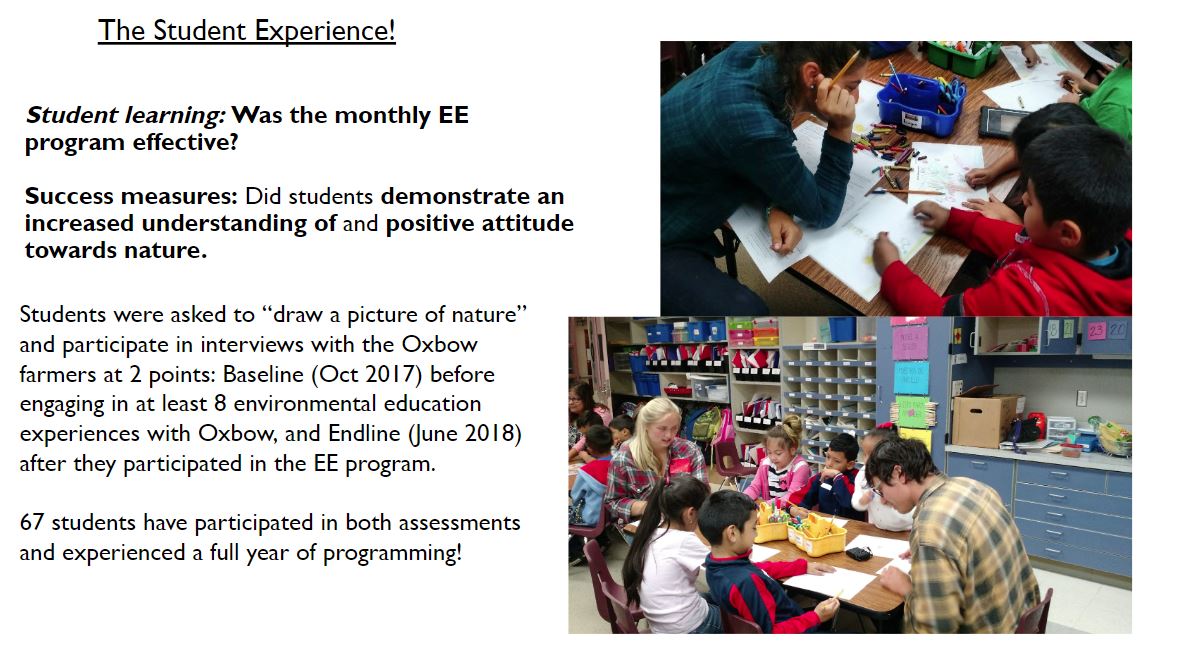
Did Oxbow’s monthly Environmental Education program move the needle? Our innovative assessment methodology asks students to “draw a picture of nature” and participate in interviews at two touch points, baseline and end-line of the monthly program.
What we know: Assessing environmental literacy and science understanding of early learners is challenging, yet early learners is a critical window for students to form a fundamental connection to nature (Wilson, 1996), and science skills (Morgan, 2016). In fact, fostering an affinity in science in a child’s early years can influence their achievement through middle school.
What we don’t know: What is the best method for assessing environmental literacy for early learners?
Here’s what we did!
 The foundations of our assessment strategy:
- This approach is entirely unique, inspired by formative, portfolio-based assessments
-
-
- Formative means that students and teachers are interacting during the time of instruction (Black, 1998)
- Portfolio-based means that the students’ work is followed over time
-
-
- Our methodology combines these approaches and involved students interacting with a facilitator at two touchpoints, at baseline and end-line of the 8-month environmental education program.
- This approach is more effective than a summative or standardized test at the end of the program, especially for early learners.
- Reciprocal relationship with students and educators, teachers can learn about the effectiveness of their instruction (Black, 1998)
- Open ended questions allows students to express their understanding
- Students define their own meaning of nature
- Portfolios are very good at highlighting success rather than failures, giving children a positive view of themselves and their progress over a period of time (Grace, 1993)
- Portfolios don’t compare children to one another but instead compare a single child’s work to their previous work (Grace, 1993)
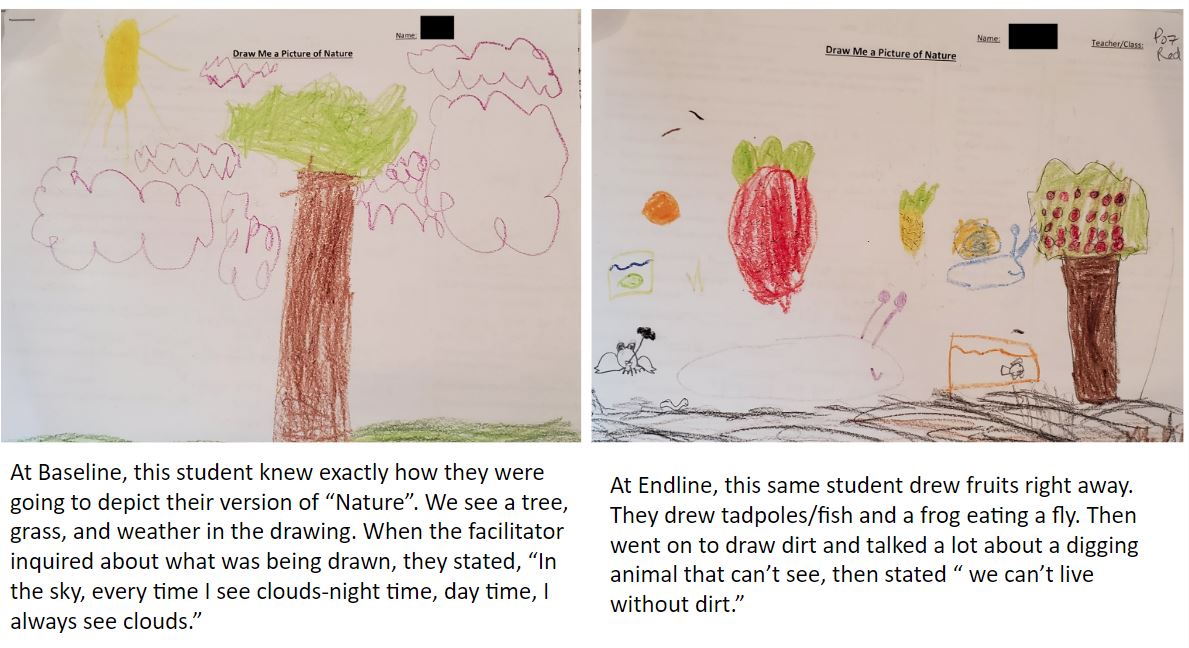
Here is one example of a side by side illustration and description from a kindergarten student:
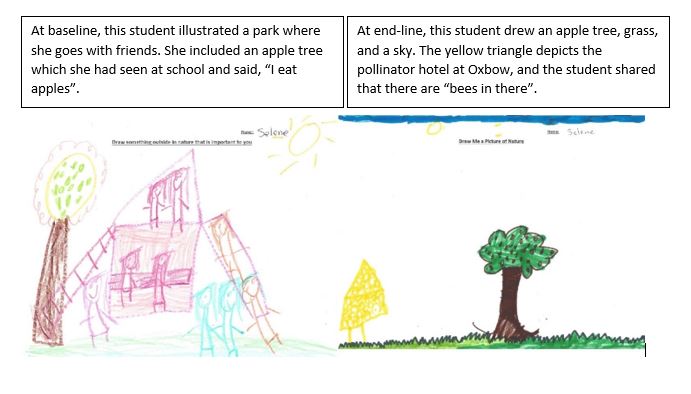
Here’s another:
Curious about the results of this assessment strategy? Watch our video presentation!
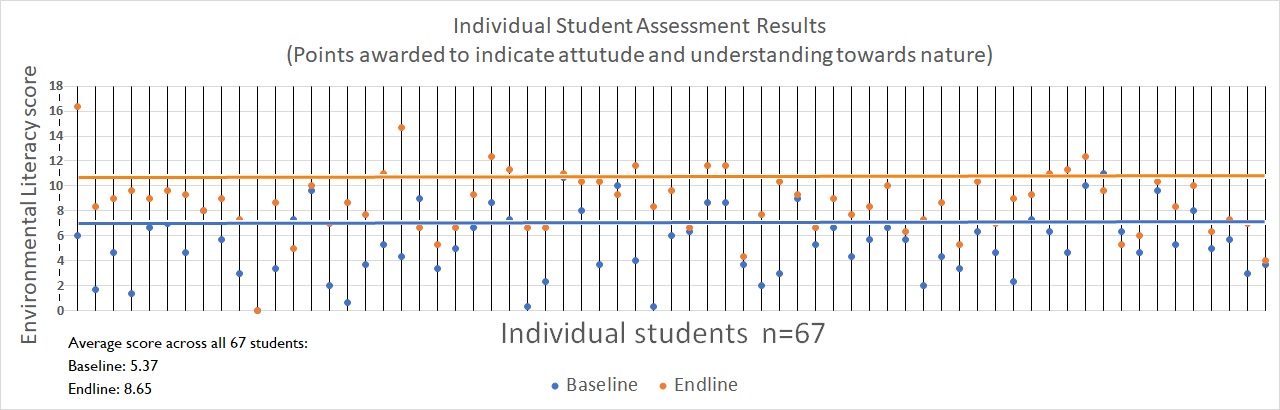
Transforming qualitative images to quantitative data: Our criteria ranking tool (or rubric) awards points to student illustrations and interviews based on nine criteria, giving us the ability to display the program outcomes in graphical form. In this chart, each student is represented by a vertical line, their baseline score is represented by a blue dot and the end-line score is represented by an orange dot. Sixty out of the 67 students increased their score from baseline to end-line and only seven students decreased or had no change in their score.
We’d love to hear from you! Contact education@oxbow.org for the student assessment resources or to give your feedback on this strategy!
References:
Black, P., & Wiliam, D. (1998). Assessment and classroom learning. Assessment in Education: Principles, Policy & Practice, 5(1), 7-74. Chicago
Grace, C. (1993) The Portfolio and Its Use: Developmentally Appropriate Assessment of Young Children. ERIC Clearinghouse en Elementary and Early Childhood Education, 45-46
Morgan, Paul & Hillemeier, Marianne & Maczuga, Steven. (2016). Science Achievement Gaps Begin Very Early, Persist, and Are Largely Explained by Modifiable Factors. Educational Researcher. 45. 18-35. 10.3102/0013189X16633182.
Wilson, R., Starting Early: Environmental Education during the Early Childhood Years. ERIC Digest, 1996